Distributed tracing:
- It is hard to locate the issue when something goes wrong in distributed microservice system as the services are distributed across multiple servers in different location, so traditional monitoring method like logs and metrics are no longer enough to understand where the fault is.
- Distributed tracing enables visibility of how request flows into the system by collecting the information such as time taken at each step , errors, failures etc.
Components of Distributed tracing:
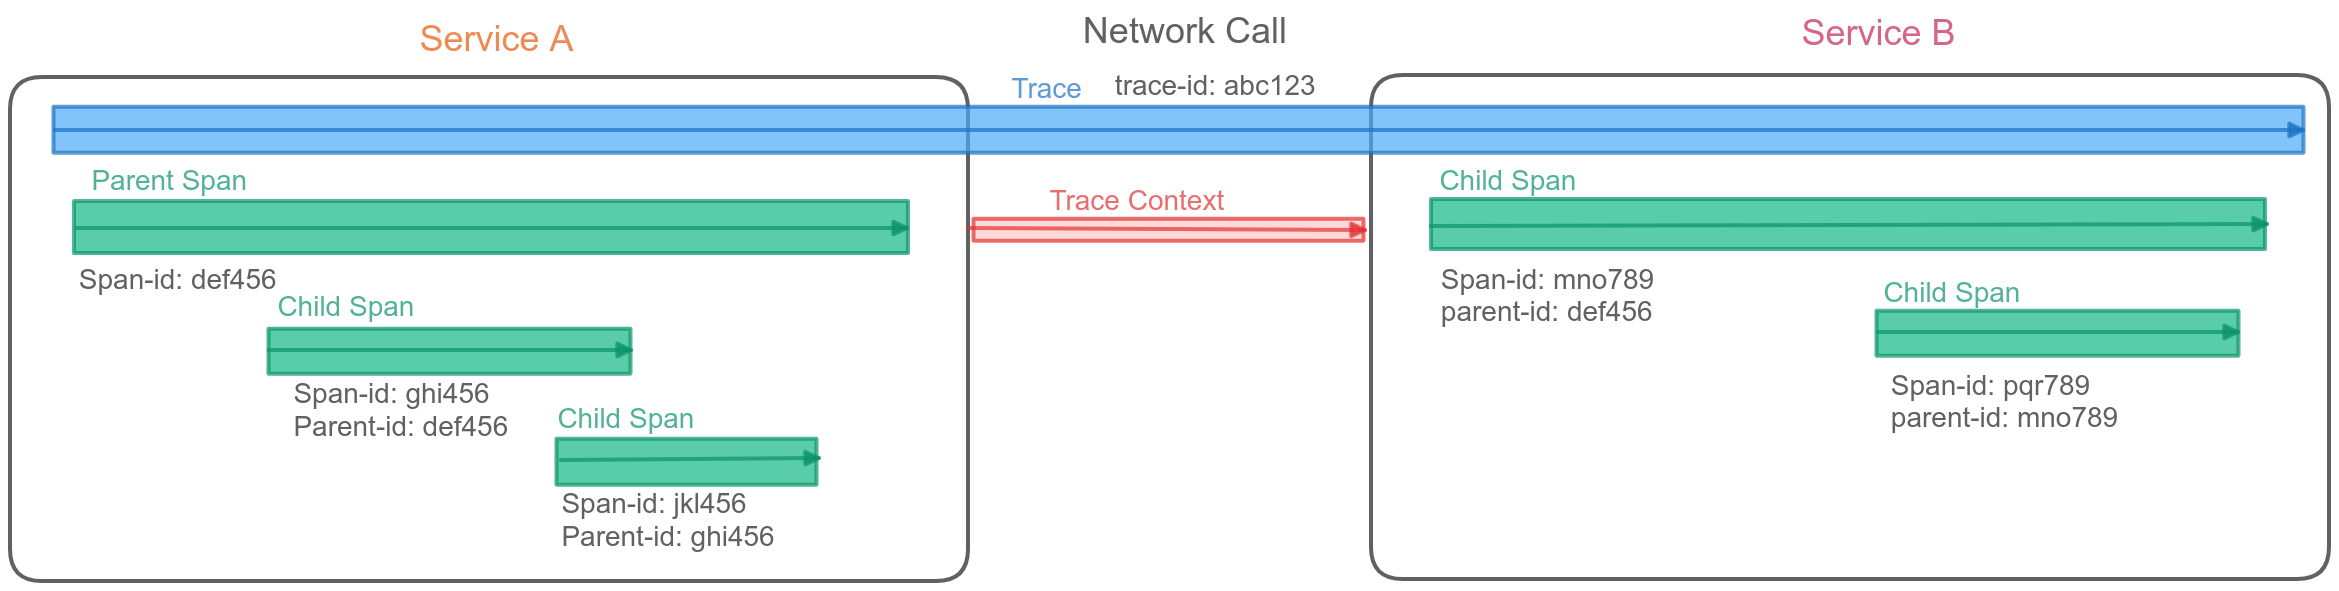
- Trace: Request from source to destination having different service hops in between. Traces are made up of spans.
- Span: A Single operation within a service. A service can have multiple spans. Primary building block of a trace.
- Context: Passing context between different components or service in a distributed system.
- Instrumentation: Instrumentation library is component that developers integrate into their applications to generate, collect and manage trace data.
- Data Store: Typically storage system that stores trace data. Eg. Elasticsearch, Cassandra, Jaeger
- Visualization: Graphical representation of the trace data. Eg. Kibana, Jaeger UI
How does distributed tracing work?
- Trace-id gets attached to an incoming request to the system. This identifies the request during its lifespan within the system.
- For every Child Span their is a Parent Span id associated.
- While the request flows in the system instrumentation library keeps on adding context data such as start time, end time, and metadata about each operation (span).
- Trace data gets stored and then is visualized.